 Ernesto Garbarino
Rogers, L. David. The Digital Transformation Playbook: Rethink Your Business for the Digital Age
- Digital Transformation Quotes
- Case Studies
- Britannica — Reinvented established business
- Industrial Revolution — Adoption of innovations
- YouVersion (Bible App) — Digital transformation in religion
- PepsiCo — Crowdsourcing
- Waze — Value of Customer Networks
- Citibank (Twitter) — Social Media Strategy
- Citibank — Breaking Silos
- Hulu (ABC, NBC & Fox) against Netflix
- The Weather Company (TWC) — Data Monetisation
- New York City’s Budget — Breaking Data Silos
- Apple’s removal of Google Apps — The value of Data
- GE Jet Engines – Data and IoT
- Coca-Cola — Customer Data Exchange
- The Metropolitan Museum of Art — Customer Data Exchange
- Cadillac — Data Mining and Customer Behaviour
- Gaylord Hotels — Data Mining and Customer Behaviour
- Custora — Predictive Analytics
- InterContinental Hotels Group — Predictive Analytics
- Kimberly-Clark — Personalisation through Data
- British Airways — Personalisation through Data
- Nike — Data in Context
- BillGuard — Data in Context
- Opower — Data in Context
- Ceaser’s Casino — Predictive Analytics
- Caterpillar — Data Sharing
- Frito-Lay — Data sharing
- Target — Data Theft
- Intuit’s Application for Farmers — Innovation
- Capital One — Convergent Experimentation
- Wawa — The value of Experimentation
- ZipCar — MVPs in the Physical World
- Google Glass — Failed MVP Strategy
- Starbucks — Polished Rollout
- Microsoft, Google and Netflix — Test and Learn Culture
- Amazon — Test and Learn Culture
- JCPenny — Failing to Test Assumptions
- Sony Music — Digital Value
- Mohawk Fine Papers — Reversing Value Decline by Finding New Customers
- The Five Domains of Digital Transformation
- Customers Domain
- Competition
- Platforms
- The Rise of Platform Businesses
- Properties of Platforms
- Types of Distinct Customers
- The Four Types of Platforms
- Network Effects
- Network Effects & “Winner Takes All”
- Mixed Platform and non-Platform Businesses
- Four Key Elements of Platforms
- The Fallacy of the “Sharing Economy”
- Competition Between Platforms
- The Platform Business Model Map
- Co-Opetition
- Platforms
- Fluid Industries and Asymmetric Competitors
- Data
- Innovation
- Value
- BackLog
- BibTeX
Digital Transformation Quotes
Pre-digital businesses are not dinosaurs doomed to extinction. Their disruption is not inevitable. Businesses can transform themselves to thrive in the digital age.
(Rogers, 2016)
Digital transformation is not about technology — it is about strategy and new ways of thinking.
(Rogers, 2016)
A Chief Information Officer’s traditional role has been to use technology to optimize processes, reduce risks, and better run the existing business. But the emerging role of a Chief Digital Officer is much more strategic, focused on using technology to reimagine and reinvent the core business itself. Digital transformation requires a holistic view of business strategy.
(Rogers, 2016)
There is absolutely no reason upstart digital companies have to supplant established firms. There is no reason new businesses have to be the only engines of innovation.
(Rogers, 2016, p. 2)
Case Studies
Britannica — Reinvented established business
Britannica understood that customers’ behaviors were changing dramatically with the adoption of new technologies. Rather than trying to defend its old business model, the company’s leaders sought to understand the needs of its core customers—home users and educational institutions, increasingly in the K – 12 market. Britannica experimented with various delivery media, price points, and sales channels for its products. But, significantly, it maintained a focus on its core mission : editorial quality and educational service. With this focus, it was able not only to pivot to a purely online subscription model for its encyclopedia but also to develop new and related product offerings to meet the evolving needs for classroom curricula and learning. “By the time we stopped publishing the print set, the sales represented only about 1 % of our business,” explained Britannica President Jorge Cauz on the anniversary of that decision. “We’re as profitable now as we’ve ever been.”
(Rogers, 2016, p. 2)
Industrial Revolution — Adoption of innovations
Not actual citation:
Factories were dependent on fixed resources of power—first, water power from waterwheels, along rivers and, later, steam power from coal-fired engines. All equipment in the factory had to be attached to a central drive shaft; this constraint dictated the factories’ design and the locations in which they could be set up. When electricity companies appeared, they had the challenge of convincing factory owners of the advantages of electrical motors so they sent trainers and engineers for free to the factories; by 1920, most old factories have been transformed to leverage electrical power.
(Rogers, 2016, p. 3)
YouVersion (Bible App) — Digital transformation in religion
Gruenewald’s biggest impact [in addition to LifeChurch.tv] may be in creating YouVersion, the world’s most popular Bible app for smartphones. With more than 168 million downloads, the app rivals some of the biggest mobile games and social networks. YouVersion allows users to read the Bible in over 700 languages, from Eastern Arctic Inukitut to Hawaiian English Creole; it is the only mobile app in the world that includes such obscure languages as Bolivian Guarani. Within a given language, there are numerous translations, including 30 versions in English — from the King James Bible, to the New International, to the ultramodern “ The Message. ” Readers can pick and choose a translation, search for any passage or phrase, and highlight, bookmark, and share what they are reading with others. Readers share more than a hundred thousand verses a day, directly from the app.
(Rogers, 2016, p. 20)
PepsiCo — Crowdsourcing
By eschewing professional ad agencies and inviting customers to compete to make the funniest thirty-second ads themselves, PepsiCo’s Doritos brand has consistently won awards for the most liked, talked about, and affective ads during the Super Bowl. PepisiCo’s Lay’s brand of potato chips has even let customers help reinvent the product. Millions of them have nominated or voted on a new potato chips flavours as part of the brand’s Do Us A Flavour social media contests.
(Rogers, 2016, p. 24)
Waze — Value of Customer Networks
[When Google acquired Waze], it immediately announced that [it] would not be rolled into Google Maps but would be kept as a separate product run by the original Israeli team that started it. Customer networks are extremely valuable, but they are intangible assets that can’t be swapped and leveraged as easily as the real estate or factory equipment.
(Rogers, 2016, p. 28)
Citibank (Twitter) — Social Media Strategy
After building up its social media leadership team, Citibank was able to resolve 36 percent of its customers’ Twitter queries within that social media channel versus only 11 percent for Wells Fargo and 3 percent for Bank of America.
(Rogers, 2016, p. 36)
Citibank — Breaking Silos
When Frank Eliason came to Citibank to take on the role of senior vice president of social media, he faced this challenge. “Inside your business, you may see yourselves as lots of different units: we’re in mortgages; business loans is someone else, and personal checking is different altogether. But from the point of view of the customer, we’re all just one brand, Citi. And when they interact with your brand on social media, they expect to be able to ask about any part of their experience with your company.”
(Rogers, 2016, p. 48)
Hulu (ABC, NBC & Fox) against Netflix
As digitization has transformed media, HBO has found itself competing with Netflix, an asymmetric challenger that is going after the same customers with a different pricing model and a completely different means of distribution. As the boundaries of the “television” industry have been redefined, HBO must compete for leverage against its distribution partners, cable companies like Comcast and Time Warner (which previously owned HBO’s parent company). It also must compete for leverage against some of its own star talent, who now have the option to work with firms like Netflix or Amazon as they develop their own original programming for direct distribution to viewers. At the same time, three of the biggest broadcast television networks—ABC, NBC, and Fox—have put aside their rivalry to cooperate in creating Hulu, a digital channel that aggregates all their content for online viewing with a mix of advertising and subscriber revenue.
(Rogers, 2016, pp. 52–53)
The Weather Company (TWC) — Data Monetisation
TWC’s data scientists work with major retailers to identify when they should predict a spike or slump in their sales so they can adjust their advertising spend (to commit more resources or to hold them back) as well as their merchandising. The company also works directly with brand advertisers—in categories like allergy medication, fleece jackets, and snow tires—to predict the best time for them to spend on ad placements. Even our snack food purchases on a given day (nacho chips or pretzels?) have been found to be shaped by whether the weather feels bright, sticky, or gloomy. With digital advertisements (inserted on websites or in apps like TWC’s own), brands now have the opportunity to adjust and target their message on the fly, choosing which image to show specific viewers based on the weather where they are standing.
TWC is even using its data to create new products and services for industries like the insurance sector. For instance, it has built an app called Hailzone for insurers like State Farm and Travelers to offer their auto insurance customers. Whenever a hailstorm is about to hit, Hailzone sends out a text message alert to those customers, warning them to move their cars inside. That saves a tremendous headache for the drivers and costly hail damage bills for the insurer.
(Rogers, 2016, pp. 89–90)
New York City’s Budget — Breaking Data Silos
A memorable example of the benefits of combining data sets comes from municipal government here in New York City. Scott Stringer, the city’s comptroller (CFO), was seeking to reduce the costs of lawsuits against the city. He launched an initiative to compare the data on lawsuits and damages paid with other city data sets, including the budgets of different departments over time. A surprising correlation was discovered: after the city’s parks budget had been slashed a few years earlier and its seasonal tree pruning reduced, legal claims from citizens injured by falling tree limbs skyrocketed. The cost to the city from a single lawsuit was greater than the entire tree pruning budget for three years! Once this was discovered and the budget funding was restored, lawsuits dropped dramatically.
(Rogers, 2016, pp. 96–97)
Apple’s removal of Google Apps — The value of Data
As part of its ongoing rivalry with search giant Google, Apple chose to remove Google Maps as the default mapping app on all iPhones. Instead, it gave iPhone customers its own new Maps app, running on data Apple had purchased from various third parties. True to form, the Cupertino company had designed a stunning user interface for its app. But it had underestimated the quality of Google’s data asset. Millions of iPhone users who were forced to use the new maps flooded Apple with complaints. Cities were misspelled or erased, tourist attractions were misplaced, famous buildings disappeared, and roads literally vanished into thin air. The errors were so bad that they compelled the first letter of apology by an Apple CEO to customers. In it, Tim Cook went so far as to advise customers to download and use competitor apps from the App Store until Apple’s own maps improved.
(Rogers, 2016, p. 93)
GE Jet Engines – Data and IoT
GE has installed sensors on its jet engines that allow the engines to continuously post updates on their status and operating details. (GE calls the system “Facebook for jet engines.”) This real-time data lets airline mechanics monitor the status of critical aircraft equipment so they can make repairs when they actually are needed rather than on a schedule of estimated need. This makes fleet maintenance more efficient and makes air travel cheaper and more convenient.
(Rogers, 2016, p. 99)
Coca-Cola — Customer Data Exchange
Because it does not sell directly to consumers, Coca-Cola historically has had little consumer data. But with the help of its MyCokeRewards loyalty program, the company has built up a data view on 20 million of its customers, the linchpin of its data asset.
(Rogers, 2016, p. 104)
The Metropolitan Museum of Art — Customer Data Exchange
The Metropolitan Museum of Art was able to gather 100,000 new, valid e-mail addresses simply by asking visitors for their e-mail addresses in exchange for access to the Met’s free Wi-Fi. What makes consumers willing to share their information with businesses?
(Rogers, 2016, p. 104)
Cadillac — Data Mining and Customer Behaviour
Netzer’s team used [the data gathered from online conversations] to investigate the impact of long-term advertising efforts. They focused on a period when Cadillac had spent millions on brand advertising to shift customers’ perception of Cadillac from “classic American car” (like Lincoln) to “luxury brand” (like Lexus and Mercedes). A textual analysis of the conversations over several years showed that, consistent with the campaign objective, the Cadillac brand was gradually moving—in customers’ associative perceptions—from the first group (classic American brands) to the second (luxury brands). When the researchers compared this with public data on dealer trade-ins, they confirmed that the shift in perception was also a leading indicator of purchase behaviors. Rather than trading between Lincolns and Cadillacs, more and more customers were exchanging their luxury cars for Cadillacs.
(Rogers, 2016, p. 108)
Gaylord Hotels — Data Mining and Customer Behaviour
Gaylord Hotels used insights from customer data to sharpen its referral strategy. The business has a few large hotel properties that are well suited for major events as well as personal stays. With a limited advertising budget, it knew that referrals (word of mouth from happy guests) were the biggest source of new customers. So management set a priority to increase that word of mouth by improving the already good guest experience. The first step was an internal review of operations that identified eighty areas of focus that might help inspire customers not only to be pleased but also to actually mention Gaylord to others. The obvious next challenge was prioritization: Which items on this long list were most important? To help, the company undertook an analysis of social media data, looking at every instance where the hotel’s name was mentioned by customers in public platforms like Twitter. Customer recommendations and praise were examined for any clues as to what had spurred them and at what point in the customer’s stay. The results were illuminating. A short list of just five elements of the guest experience seemed to have the greatest influence in sparking word of mouth, and all of them took place in the first twenty minutes after arrival.
(Rogers, 2016, p. 108)
Custora — Predictive Analytics
Custora can predict that they are likely to make six purchases in the upcoming year, totaling $275 and placing them among the top 5 percent of the company’s customers. Other predictions based on historical data include the category the customer’s next purchase will likely come from (e.g., home furnishings vs. lawn care). The model can even provide warning signs—such as predicting that if this customer doesn’t place an order for three consecutive months, the business can assume they have only a 10 percent chance of returning.
(Rogers, 2016, p. 109)
InterContinental Hotels Group — Predictive Analytics
InterContinental Hotels Group carefully uses data on the 71 million members of its Priority Club loyalty program to understand and target them more effectively. This data includes much more than zip code and hotel room preferences. Up to 4,000 different data attributes—such as their income level, their preferred booking channel, their use of rewards points, and whether they tend to stay over weekends—are used to assign each member to a customer group. This level of segmentation has allowed the hotel to shift from sending out a dozen varieties of an e-mail marketing message to sending out 1,552 different variations, targeted around past behaviors and special offers such as local events. These new marketing campaigns have generated a conversion rate (the portion of customers accepting the offer sent) that is 35 percent higher than that of less targeted campaigns the year before.
(Rogers, 2016, p. 109)
Kimberly-Clark — Personalisation through Data
Kimberly-Clark, which sells some of the biggest brands in diapers (among other personal care products), uses an audience management platform that integrates data from sales and media channels to build an integrated view of the “customer journey” of each customer. For the company’s business, that means tracking a family’s progression through various products—from Huggies newborn, to full-size diapers, to transitional pull-ups during toilet training and “Little Swimmers” (for kids just starting out in the pool). Keeping track of each customer allows it to advertise the right product to the right family.
(Rogers, 2016, p. 110)
British Airways — Personalisation through Data
British Airways has launched a service personalization program known internally as Know Me. Its goal is to bring together diverse data to create a “single customer view” that will help airline staff to make a more personal connection with each customer. Know Me started with a two-year project to link data from commercial, operational, and engineering systems and put it at the fingertips of customer service directors. But the program works only because the data analytics are linked to the judgment and “emotional intelligence” of the British Airways service staff. Know Me data is used to deepen staff awareness of fliers’ personal needs and preferences, and staff are empowered to make their own observations and record data that helps personalize future trips. This feedback loop helps the airline deliver more-relevant offers to each customer and provide personalized recognition and service during a trip. That can include recognizing a VIP business traveler—even when traveling in coach class with family—so that service staff can welcome and thank them and offer a glass of champagne. It could also mean providing discreet assurances to a customer who has previously indicated they have a fear of flying.
(Rogers, 2016, pp. 110–111)
Nike — Data in Context
Nike customers who track their running data don’t just want to know how they did today; they also want to know how today’s performance compares to their own performance over the last week or month, to the goals they have set, and to the activity of friends in their social network. Context is king.
(Rogers, 2016, p. 112)
BillGuard — Data in Context
BillGuard is a popular financial protection app that tracks its customers’ credit card statements and helps identify both fraudulent billing (e.g., if the card was one of 50 million hacked in the latest cyberscandal) and “grey” charges (hidden fees customers likely didn’t realize a company was charging them). BillGuard’s algorithms are effective precisely because they compare a customer’s bills against the anonymized bills of peers and against whatever charges were flagged as questionable by any other customers in its community.
(Rogers, 2016, p. 112)
Opower — Data in Context
Opower has developed a data-driven service to influence home power consumption. The company, which works with local utilities, shows consumers data on how their own energy usage compares with that of their neighbors. The result: consumers are much more likely to reduce their energy consumption when shown comparative data.
(Rogers, 2016, p. 115)
Ceaser’s Casino — Predictive Analytics
Caesar’s can determine when a repeat visitor is having a bad night on the gambling floor and will send service staff to offer an unexpected gift—a steak dinner, tickets to a show—so the customer won’t leave feeling they had “bad luck” at Caesar’s and should try another casino.
(Rogers, 2016, p. 115)
Caterpillar — Data Sharing
Industrial equipment manufacturer Caterpillar now requires its 189 dealers to enter into data-sharing agreements; in return, it provides them with benchmarks and tools to improve their own sales efficiency and with customer leads generated from Caterpillar’s Web analytics.
(Rogers, 2016, p. 120)
Frito-Lay — Data sharing
Ann Mukherjee, chief marketing officer of Frito-Lay, is able to measure the impact of all kinds of innovative digital marketing for popular brands like Doritos and Lay’s, but this measurement is possible only due to partnerships with key retailers. “Retailers are unbelievable sources of analytical understanding,” and the ability to partner with them around data and measurement is critical to building store traffic and product sales.
(Rogers, 2016, p. 120)
Target — Data Theft
When Target suffered a huge data breach in 2013, with 40 million customer credit cards stolen, it was not just an IT problem but also a brand reputation issue. Sales at the retailer slumped as consumers stayed away during the holiday shopping season, and the CEO was forced to step down a few months later.
(Rogers, 2016, p. 120)
Intuit’s Application for Farmers — Innovation
Nathan R. Furr and Jeffrey H. Dyer, The Innovator’s Method: Bringing the Lean Start-Up Into Your Organization (Boston: Harvard Business Publishing, 2014), 13–14. Intuit was one of several companies singled out in research by Furr and Dyer as applying a lean and iterative approach to innovation; the authors measure the impact of this approach in terms of an “innovation premium”—the premium that investors will pay for a company’s stock compared to the net present value of its existing business revenues.
Capital One — Convergent Experimentation
Capital One bank used convergent experiments to test the right promotional offer, the right target audience, and even the right color of envelopes as it mailed out credit card invitations. By running tens of thousands of experiments each year that focused on customer acquisition and lifetime value, it grew from a small division of another bank into an independent company worth $42 billion.
(Rogers, 2016, p. 130)
Wawa — The value of Experimentation
When Wawa introduced a flatbread sandwich to its menu in a number of test stores, the chain measured customer adoption and found the product was a big popular success. But it also measured the change in overall profitability at the stores. It turned out that customers were spending less on other, higher-margin items, so Wawa was actually losing money thanks to the popular new sandwich. Rather than rolling it out to more stores, the chain pulled it from the menu entirely.
(Rogers, 2016, p. 139)
In the 2008 presidential contest, the Obama campaign ran test after test, examining the effects on fund-raising appeals of changing many different elements—the subject of the request, the kind of photos and videos, the “call to action” words on the button that led you to a donation page. Each subsequent test added a bit more learning, but the cumulative effect was to raise the final rate of conversions—from e-mail to website to volunteer sign-up to donation—by 40 percent, or an estimated $57 million of additional fund-raising.
(Rogers, 2016, p. 146)
ZipCar — MVPs in the Physical World
An example of a locally limited MVP rollout is the launch of Zipcar. This was one of the first services to allow members to rent a car by the hour, picking the cars up at street locations identified online rather than having to visit a car rental office. Founder Robin Chase launched Zipcar as an MVP only six months after beginning work on the business and having raised just $75,000. She was able to do this partly because she began only in Boston, waiting more than a year to extend to a second location. This allowed her to test out the business model and iterate her service with feedback from paying customers.
(Rogers, 2016, p. 156)
Google Glass — Failed MVP Strategy
By contrast, we can look at Google Glass. The wearable eye-frame computing device was released publicly while it was still buggy and before Google was even clear on the value proposition for the user. The company failed to iterate Glass meaningfully within a year because it was still just trying to get the device to work consistently. It was probably used to operating in the MVP rollout quadrant (where it had launched Gmail and countless other software products), and it underestimated the discipline necessary when releasing a hardware product, especially one that would be attracting massive media attention. Although Google released Glass to only a few thousand customers, the prominence of its brand and the controversial nature of the product (with its ability to record video incognito) ensured that the release was subject to prolonged and intense scrutiny. A national conversation ensued about what Glass meant for the future of computing and privacy, and the company, which grew up with the most casual of beta-style launches, learned that not every new innovation can be released the same way.
(Rogers, 2016, p. 158)
Starbucks — Polished Rollout
Starbucks has tested diverse ideas, such as offering local wines and craft beers, in a set of store locations in Seattle. The company first tested wireless charging mats for phones at stores in Boston before rolling them out nationwide. It even tested a coffee delivery service (via mobile app) by making it available exclusively to customers working in New York’s Empire State Building.
(Rogers, 2016, p. 157)
Microsoft, Google and Netflix — Test and Learn Culture
One survey of experiment-focused businesses reported that two-thirds of the new ideas tested by Microsoft failed to deliver any of their expected benefits. Only 10 percent of Google’s experiments were successful enough to lead to business changes. And Netflix has estimated that 90 percent of what it tries turns out to be wrong.38
(Rogers, 2016, p. 159)
Amazon — Test and Learn Culture
Greg Linden, a former Amazon developer. He was working on Amazon’s checkout process when he came up with the idea of offering shoppers a final set of product recommendations as they checked out, based on the items that were already in their shopping cart. When he presented the idea, senior management hated it. It was a cardinal rule of e-commerce to not distract or get in the way of the shopper once they have begun the checkout process. But Linden kept thinking about how checkout shelves in real-world supermarkets are ideal for getting customers to pick up just one more item on their way out. Although he had been forbidden to work further on the project, he went ahead and built a quick test version of the feature. The senior vice president who had voted down his idea couldn’t have been happy, but the company let Linden run the test anyway. (At Amazon, it was hard for even a top executive to block a test experiment.) The data came back, and Linden’s innovation turned out to be extremely profitable. Resources were immediately applied to developing and launching a full version of it.
(Rogers, 2016, pp. 159–160)
JCPenny — Failing to Test Assumptions
In 2011, Johnson left Apple to take over as CEO of struggling retailer JCPenney. Johnson had a bold vision to reinvent the discount department store with a more modern, Apple Store–like environment. The retail experience was to be transformed—featuring smaller shops within the store, cool coffee bars to hang out in, and new outside brands like Martha Stewart. Eventually, all cash registers and checkout counters would be replaced with high-tech product-tracking and self-checkout systems. Johnson pledged to reinvent pricing as well, shifting from heavy use of coupons and sales promotions to reliance on standardized pricing year-round. It was a truly bold hypothesis, but would JCPenney’s customers respond positively to a radically different type of store? Unfortunately, after years of success leading retail teams at Apple, Johnson felt no need to test his hypothesis. Instead, he simply rolled it out, with no pilots and no limited test markets. The result was a catastrophe. The company, which had already been suffering for years, fell into much steeper decline. A little after a year under Johnson’s leadership, its quarterly results showed a 32 percent drop in same-store sales—what some observers suspected was the worst decline ever reported by a major retailer in history.41 Seventeen months into his tenure, Johnson was ousted as CEO.
(Rogers, 2016, p. 160)
Sony Music — Digital Value
trend). “At the beginning of the digital revolution it was common to say that digital was killing music,” Edgar Berger, CEO of Sony Music International, commented to the New York Times. Since 2012, he says, “digital is saving music.”
(Rogers, 2016, p. 167)
Mohawk Fine Papers — Reversing Value Decline by Finding New Customers
Like many paper manufacturers, Mohawk Fine Papers found itself in a declining market at the start of the twenty-first century as the rise of digital communications enabled customers to reduce their use of paper. Founded in 1931, the firm had built its business selling high-quality paper to large corporations like GE and Exxon Mobil for use in annual reports and other glossy corporate brochures. Mohawk found its market declining severely as its traditional customers relied more on digital communications. The shift accelerated once the Securities and Exchange Commission started allowing firms to submit financial reports digitally and the New York Stock Exchange stopped requiring that annual reports be printed for shareholders (these had made up a third of Mohawk’s revenue). Mohawk’s management led a turnaround by finding a new type of customer that could make use of their fine-quality papers: online stationery services. With the growth of websites for printing photos, greeting cards, and business cards, the firm convinced companies like Shutterfly.com and Moo.com to try offering the kind of high-quality papers that were Mohawk’s specialty. Stationery consumers took to them immediately, happily paying extra for paper that gave their materials a look and feel of real quality. Within a few years, Mohawk’s sales to online businesses had increased dramatically, offsetting the loss of its old customers and putting the company back on steady footing.
(Rogers, 2016, pp. 170–171)
The Five Domains of Digital Transformation
Introduction

Customers
In traditional theory, customers were seen as aggregate actors to be marketed to and persuaded to buy. The prevailing model of mass markets focused on achieving efficiencies of scale through mass production (make one product to serve as many customers as possible) and mass communication (use a consistent message and medium to reach and persuade as many customers as possible at the same time). In the digital age, we are moving to a world best described not by mass markets but by customer networks. In this paradigm, customers are dynamically connected and interacting in ways that are changing their relationships to business and to each other.
Competition
Today, we are moving to a world of fluid industry boundaries, one where our biggest challengers may be asymmetric competitors—companies from outside our industry that look nothing like us but that offer competing value to our customers. Digital “disintermediation” is upending partnerships and supply chains—our longtime business partner may become our biggest competitor if that partner stars serving our customers directly. At the same time, we may need to cooperate with a direct rival due to interdependent business models or mutual challenges from outside our industry. Rather than a zero-sum battle between similar rivals, competition is increasingly a jockeying for influence between firms with very different business models, each seeking to gain more leverage in serving the ultimate consumer.
Data
Today we are faced with a data deluge. Most data available to businesses is not generated through any systematic planning like a market survey; instead, it is being generated in unprecedented quantities from every conversation, interaction, or process inside or outside these businesses. Big data tools allow firms to make new kinds of predictions, uncover unexpected patterns in business activity, and unlock new sources of value. Rather than being confined to the province of specific business intelligence units, data is becoming the lifeblood of every department and a strategic asset to be developed and deployed over time.
Innovation
The new approach to innovation is focused on careful experiments and on minimum viable prototypes that maximize learning while minimizing cost. Assumptions are repeatedly tested, and design decisions are made based on validation by real customers. In this approach, products are developed iteratively through a process that saves time, reduces the cost of failures, and improves organisational learning.
Value
In the digital age, relying on an unchanging value proposition is inviting challenge and eventual disruption by new competitors. The only sure response to a shifting business environment is to take a path of constant evolution, looking for every technology as a way to extend and improve our value proposition to our customers. Rather than waiting to adapt when change becomes a matter of life of death, businesses need to focus on seizing emerging opportunities, diverting from declining sources of advantage, and adapting early to stay ahead of the curve of change.
(Rogers, 2016, pp. 5–10)
Customers Domain
Key points:

Customers in the digital age are not passive consumers but nodes within dynamic networks—interacting and shaping brands, markets, and each other.
(Rogers, 2016, p. 21)
Today, customers expect to listen to any song at any time, streaming from a variety of services on a variety of devices. They discover music through search engines, social media, and the recommendations of both friends and algorithms. Musicians may skip the record label and go directly to the customers themselves. They ask customers to help fundraise for an album before it is even recorded, to share it on their playlists, and to connect their favorite brands to peers in their social networks
(Rogers, 2016, p. 21)
In the twentieth century, businesses of all kinds were built on a mass-market model. In this paradigm, customers are passive and are considered in aggregate. Their only significant role is to either purchase or not purchase, and companies seek to identify the product or service that will suit the needs of as many potential customers as possible. Mass media and mass production are used to deliver and promote a company’s offerings to as many customers as possible. Success in the mass-market model hinges on efficiencies of scale.
(Rogers, 2016, p. 21)
In [the network model], the firm is still a central actor in the creation and promotion of goods and services. But the new roles of customers create a more complex relationship. No longer are they relegated to a binary role of “buy” or “do not buy”. In the customer network mode, current and potential customers have access to a wide variety of digital platforms that allow them to interact, publish, broadcast, and innovate—and thereby shape brands, reputations, and markets. Customers are just as likely to connect with and influence each other as they are to be influenced by the direct communications from a firm.
(Rogers, 2016, p. 22)
The firm needs to engage with its customer network. It needs to listen in, observe the customers’ networked interactions, and understand their perceptions, responses, and unmet needs. It needs to identify and nurture those customers who may become brand champions, evangelists, marketing partners, or cocreators of value with the firm.
(Rogers, 2016, p. 22)
A brand is no longer something that a business alone creates, defines, and projects outward; it is something that customers shape, too, and the business needs their help to fully create it. Many customers want to do more than just buy products and brands; they want to co-create them.
(Rogers, 2016, p. 24)

Todays customer networks make their biggest impact on the marketing funnel through an additional level, which I call advocacy. At this psychological stage, customers are not just loyal; they advocate for the brand and connect the brand to people in their network. These customers post photos of products on Instagram, write reviews on TripAdvisor, and answer friends’ product questions on Twitter. Thanks to search engine algorithms, this type of customer expression is heavily weighted to influence search results. Each customer’s advocacy thus feeds back up to the top of the funnel and has the potential to increase the magnitude of awareness, consideration, and so on through the funnel.
(Rogers, 2016, p. 27)
Today’s customers may be consulting a search engine, the company’s website, a mobile app, a local map search, a physical retailer, online retailers, peers on social media, the company’s own social media accounts, instant chat, and customer review sites.
(Rogers, 2016, p. 27)
[The existence of several Customer touchpoints] open multiple paths to a purchase. To effectively market to customers, business must think about the specific needs that will lead customers to take one path to purchase versus another: How quickly do they need the product? How price sensitive are they? Do they already have a preferred brand? How close are they to physical retailers? And so on. Business can increase their influence by mapping and optimizing the customer experience on each path. They begin this process by developing an “omni-channel” view of the customer—based on an understanding that the same customer may be using a tablet app and a desktop computer and walking into a store. Designing each touchpoint experience in isolation, as if it were for a different customer, dilutes and disrupts the brand experience. An omni-channel experience uses design to integrate the path to purchase as it moves from one touchpoint to the next.
Five Customer Network Behaviours

Overview
- Access to digital data, content, interactions:
- Immediate, instant, quick
- Flexible
- Engage with digital content
- Sensory
- Interactive
- Relevant
- Customize: and modify
- Experiences
- Information
- Products
- Services
- Connect: with one another by sharing
- Experiences
- Ideas
- Text
- Images
- Social Links
- Location
- Collaborate: on open platforms
- On projects
- Goals
(Rogers, 2016, pp. 29–30)
Five Customer Networks Behaviours and Customer Network Strategies

Access Strategy
Customers may, at different times, choose to buy a product online or in a store (even choosing the more expensive option), depending on which method gives them greater convenience. And that convenience depends on context : Am I buying something I want to use right now ? Is it something heavy that is easier to have shipped to my home? Can I afford to wait a day or two for delivery?
- Mobile commerce
- QR codes
- Mobile Payment Systems
- In-Store Targeting
- Omni-channel experiences
- Store versus At Home experience
- Store versus At Home experience
- Working in the cloud
- Products that exist entirely in the Cloud (e.g Spotify)
- SaaS business model
- On-demand services
- Banking services
- Education (e.g. Coursera)
(Rogers, 2016, pp. 29–33)
Engage Strategy
The profusion of media channels and forms has fragmented the audience for traditional media, where brands historically placed advertising. In this context, businesses must expand their approach beyond interruption advertisements—messages that customers see only because they piggyback on or interrupt content that customers are genuinely interested in. Business need to adopt a different mindset and learn to create their own content that is relevant enough for customers to seek it out, consume it, and even share it within their networks. At the same the, this content must add value to businesses by enhancing their customer relationships.
The key to an engage strategy is to think like a media company, focused every day on earning the attention of your audience.
- Product demos
- Demonstrate value proposition
- Involve celebrities. E.g. L’Oreal & “Zombie Boy”
- Storytelling
- Emotionally compelling story linked to product
- Example: “A Day Made of Glass” by glass manufacturer, Corning
- Utility
- Useful content at the right time
- Example: Columbia’s Knot Tying App
- Brands as Publishers
- Becoming publishers in their own right
(Rogers, 2016, pp. 32–34)
Customize Strategy
The keys to a customize strategy are identifying the areas where your customers’ needs and behaviours diverse and finding the right tools to either personalize on their behalf or empower them to personalize their own experiences.
- Recommendation Engines
- Micro-genres (e.g. “Mother-Son Movies from 1970”)
- Behavioural Data + Tagging
- Impact is measured by how infrequently customers bother to use search functions
- Personalized interfaces:
- Lancome’s magic mirror (try beauty products on one’s face)
- Personalized products and services:
- Coca Cola Personalized Cans with Names
- 3d printing makes it easy
- Personalized messages and content:
- The most appropriate content for each customer
- Thumbs Up or Down: invite readers to indicate their interest
(Rogers, 2016, pp. 34–36)
Connect Strategy
Whether answering customers’ questions, solving their problems, or providing product news, businesses are expected to be present, responsive, and active in social media conversations.
- Social listening
- Insights from customer conversations (e.g. identification of outages by Comcast)
- Social customer service
- Social media as channel for support services in addition to call centers
- Successful support to impress networks rather than just one customer
- Evangelization opportunity
- Example: Citibank Twitter queries resolution team
- Joining the conversation
- Contributing to social groups of interest through Facebook, YouTube, etc.
- Example: Maersk Line, a container shipping company.
- Asking for ideas and content
- Suggestions for product features
- Actual content. E.g. GoPro videos shot by customers
- Hosting a community
- SAP Community Network
- Procter & Gamble’s BeingGirl.com forum higher ROI than TV Ads for Tampax and Always brands
(Rogers, 2016, pp. 36–37)
Collaborate Strategy
Mass collaboration does not happen without careful attention to creating the right context and the right motivations for participants to take action and to feel they are being fairly treated.
- Passive contribution
- Waze collection of traffic conditions
- Duolingo using homework assignments to power its web translation tool
- Active contribution
- CNN’s iReport allows anyone to contribute videos, photos, videos, eyewitness reports, etc.
- Crowdfunding
- New projects, products & initiatives
- Also used raise seed capital for new businesses
- Open competitions
- Find the best answer to a solution
- Hackathons
- Appathons
- Collaborative platforms
- Don’t try to define what the next crop of projects should be
- Focus on providing a structure on which others can build
(Rogers, 2016, pp. 37–40)
The Customer Network Strategy Generator

1 — Objective Setting
Identify direct and high-order objectives:
- Direct objectives: those that you are directly responsible for addressing in your project.
- Higher-order objectives: those that are overarching, and support other domains and lines of business.
2 — Customer Selection and Focusing
Qualify each customer segment:
- Customer segment selection: most relevant to the stated objectives. E.g. those with the highest rates of attrition
- Unique objective for each segment: and how it differs from other segments.
- Unique value proposition for each segment: and how it varies for each segment.
- Unique barriers to success for each customer segment: for example, price sensitivity, technical hurdles, risks aversion, etc.
3 — Strategy Selection
Derive strategies from the five core customer network behaviours. Sometimes not all of the five strategies may be applicable:
- Access: Be faster, easier, be everywhere, and be always on for your customers.
- Engage: Become a source of valued content for your customers.
- Customize: Make your offering adaptable to your customers’ needs.
- Connect: Become a part of your customer’s conversations.
- Collaborate: Invite your customers to help build your enterprise.
4 — Concept Generation
- Access
- How to make the experience faster, simpler and easier
- How to better integrate different interactions?
- How to make service more accessible, more on-demand, more self-serve?
- Engage
- How to earn the attention of your your audience?
- What problem could you solve for your customers with the right content or information at the right time?
- Would anyone not working at your company recommend this content to a friend?
- Customize
- Where do your customers’ needs and interests differ most from each other?
- Why would your customers want a more personalized experience? For better utility? For unique interests? For self-expression?
- How to make it easy, and not overwhelming, for your customers to make the right choice for themselves?
- Connect
- What conversations are your customers already having that are relevant to your objectives?
- How could you enable, facilitate, or enhance those conversations rather than intruding on them?
- What could you learn from your customers’ conversations?
- What could you contribute to these conversations that your customers would value?
- Collaborate
- What skills could your customers bring to bear, and what are the limits in their ability to contribute successfully?
- What would most motivate customers?
- Excitement about your brand, cause, or project?
- Social recognition?
- Monetary rewards?
- Or some combination of these?
5 — Defining Impact
For each strategic concept, you need to devise a baseline and KPI to tell whether you have achieved your objectives. (not actual citation)
(Rogers, 2016, pp. 39–46)
Employee Networks
Joseph Tripodi identifies three network types:
- End consumers
- Business customers: retailers, analysts, or opinion elites who influence your industry and regulations.
- Own employees: as workforces become more mobile, business need to help employees
- access their work more easily and flexibly.
- engage with the right content, information, and resources to stay informed for their job.
- connect with each other—to share knowledge and to ask and answer questions.
- customize their workflow around flexile travel, roles and schedules.
- collaborate using tools that allow them to share projects and files while working remotely and asynchronously.
- access their work more easily and flexibly.
(Rogers, 2016, p. 46)
Competition
In the digital age, the boundaries between industries are blurring, and so is the distinction between partners and competitors. Every relationship between firms today is a constantly shifting mix of competition and cooperation.
(Rogers, 2016, p. 52)
Platforms
A platform is a business that creates value by facilitating direct interactions between two or more distinct types of customers.
(Rogers, 2016, p. 62)
The Rise of Platform Businesses
Platforms represent a fundamental shift in how businesses relate to each other—from linear to more networked business models. Platform businesses can often be very light in assets but generate large revenues. Instead of building features and seeking to get customers to use their own products, they build ecosystems by getting customers to interact with each other.
- Retail: Taobao, eBay, Amazon Marketplace
- Media: YouTube, Forbes.com * Advertising: Google, Baidu, Craigslist
- Finance: PayPal, Kickstarter, Alipay * Gaming: Xbox, PlayStation
- Mobile computing: iOS, Android, Xiaomi
- Business software: SAP, Salesforce * Home appliances: Philips, Nest * Hospitality: Airbnb, TripAdvisor * Transportation: Uber, Didi Kuaidi * Education: Coursera, Udemy
- Recruiting and job search: LinkedIn, Glassdoor
- Freelance work: Upwork, Amazon Mechanical Turk
- Philanthropy: Kiva, DonorsChoose
(Rogers, 2016, pp. 54–55)
Properties of Platforms
- Distinct type of customers: For example, buyer and sellers. Skype, for instance, is not a platform since the customers are of the same type.
- Direct interaction: In a platform such as Airbnb or eBay, the two parties are free to create their own profiles, set and negotiate pricing, and decide how they want to present their services or products. This is a critical distinction between a platform and a reseller or sales channel.
- Facilitating: The interactions take place and are facilitated by the platform business.
(Rogers, 2016, pp. 55–56)
Types of Distinct Customers
- Airbnb
- Hosts
- Renters
- Uber
- Freelance drivers
- Riders
- DonorsChoose
- Schoolteachers seeking grants
- Donors
- PayPal
- Account holders
- Merchants
- Banks
- YouTube
- Video viewers
- Video creators
- Advertisers
- Google search
- Search engine users
- Website creators
- Search advertisers
- Forbes.com
- Independent writers (not employees)
- Readers
- Advertisers
- Android Operating System
- Phone and tablet users
- Hardware manufacturers
- App developers
- In-app advertisers
- Salesforce.com
- Software users
- App developers creating additional integrated services
(Rogers, 2016, pp. 54–55)
The Four Types of Platforms
- Exchanges: they bring together two distinct group of customers for a direct value exchange
- Transaction Systems: they act as an intermediary between different parties to facilitate payments and financial transactions. To succeed (e.g. PayPal or Apple Pay), these platform must get sufficient numbers on board from each party.
- Advertised-supported media: as the platform attracts more people, its value to advertisers increases. The advertisers, in turn, provide value to the audience by reducing or eliminating the cost of content for them.
- Hardware/software standards: they provide a uniform standard for the design of subsequent products to enable their interoperability and benefit the ultimate consumer.
Network Effects
- Direct Network Effects (Same-side) An increasing number of customers or users of a product drives an increase in value or utility for the same type of user (Metcalfe’s law). For example, Facebook’s users find the platform valuable the more other users are on the platform—rather than advertisers.
- Indirect Network Effects (cross-side): an increase in the number and quality of customers on one side of the platform drives increasing value for customers on the other side of the platform. For example, the more Visa cardholders there are, the more attractive is for a merchant to accept Visa.
Indirect network effects are not always reciprocal: In advertising-supported media, the indirect network effects usually run only one way: as the number of readers increases for a newspaper, its value to advertisers increases as well, but increasing the number of ads in each issue does not directly increase the value for readers.
(Rogers, 2016, pp. 59–60)
Network Effects & “Winner Takes All”
Once a platform is widely established in its category, it is extremely hard to launch a direct challenger with a similar service—a result of the power of network effects.
In a platform with network effects for all parties, new challengers face a formidable barrier to entry. In most cases, this leads toward consolidation around a few very dominant players holding the large majority of the market (e.g., credit cards, search engines).
(Rogers, 2016, p. 65)
This kind of winner-take-all total consolidation is likely to happen when three factors are present:
- Multihoming—using more than one platform—is hard for the customer (e.g., nobody wants to buy two DVD players, whereas carrying two credit cards is easy).
- Indirect network effects are strong (e.g., viewers care what format Hollywood will release movies on, and Hollywood cares what format viewers use)
- Feature differentiation is low (e.g., there were never going to be major differences in features among DVD players—product differentiation would mostly reside in the TV sets).
The real threat to Google is not that another company will develop a similar search engine (e.g., Bing) but that users and advertisers will be drawn away to other kinds of search tools, like voice search via Siri, product search on Amazon, or other specialized search tools for travel, clothing, or other categories.
(Rogers, 2016, pp. 66–67)
Mixed Platform and non-Platform Businesses
Examples
- Amazon’s own store and Amazon Marketplace. In 2014, Amazon reported that 42 percent of its units sold were from its Marketplace partners.
- Apple TV & Netflix
Four Key Elements of Platforms
- Frictionless acquisition: The process of acquiring new customers is frictionless thanks to the Web, APIs, SDKs, and so on.
- Scalable growth: Cloud computing allows any size business to rapidly scale the size of its platform as fast as it can acquire new customers.
- On-demand access and speed: Mobile computing means that every platform now can be accessible to all of its customers any time.
- Trust: The ability to authenticate customers through their Facebook, Google, Twitter, or Linked-in identities make it much easier for even a small start-up to use a verification system for new customers on its platform.
(Rogers, 2016, pp. 62–63)
The Fallacy of the “Sharing Economy”
This phenomenon is often mislabeled the “sharing economy.” In actual fact, very few platforms have been established to share assets or labor free of charge, and those that do (Freecycle, NeighborGoods, etc.) are all small. The popular platforms that are commonly cited as evidence of the sharing economy are, in fact, better described as a “rental economy” (renting assets on Airbnb), a “resell economy” (selling used assets on eBay), or a “freelance economy” (selling labor on Uber).
(Rogers, 2016, pp. 67–68)
Competition Between Platforms
Platforms don’t compete just with traditional businesses (Uber vs. a traditional car service). They also compete against other platforms. They attempt to differentiate themselves in the following categories:
- Network-added value
- More participants (network effects)
- Quality of goods and services from participants
- Data shared by participants
- Platform-added value
- Unique features and benefits
- Free content
- Open standards
- Web or app interfaces
- SDKs and APIs
- Platform control points
- Interaction tools
- Targeting and matchmaking tools
- Transaction enablers
- Trust enablers
- Identification systems
- Reputation systems
- Financial safeguards
- Noncompetitive assurances
(Rogers, 2016, p. 68)
The Platform Business Model Map

The Model Map to answer these important questions:
- Whom do you need to bring on board to make your platform work?
- How will you monetize?
- Who are your most important customers? (These are likely both the primary payer and the linchpin.)
- Is your business model in balance? Does each party receive enough value to attract its participation? Does each party contribute enough value to justify its inclusion?
Analyzing another firm’s platform will help you to answer these important questions:
- Who are the platform’s key customers?
- What is the role, or value contribution, of each customer type?
- What draws each party to the platform
- How does the platform monetize?
- What value do you provide if you are a customer of the platform?
- How could you extract or leverage more value from the platform?
(Rogers, 2016, p. 73)
Co-Opetition
The term co-opetition was coined by Novell founder Ray Noorda and popularized by Adam Brandenburger and Barry Nalebuff in a book of the same name.
Michael Porter, perhaps the most famous management thinker on competition, criticizes this view of “competition to be the best” and warns that it is a path to mediocre performance. Simplistic striving for market share (remember GE CEO Jack Welch’s famous insistence on being #1 or #2 in every industry) leads to price wars and low profitability. Aiming to be the generic “best” (as in the rallying cry of General Motors CEO Dan Akerson, “May the best car win!”) obscures the importance of finding a unique way of creating value for customers, as this presumes there is only one way. A zero-sum view of competition sets up a race to the bottom that no one can win.
The right strategy for rival businesses is often a mix of competition and cooperation on different fronts.
In Brandenburger and Nalebuff’s view, rival companies must cooperate to “grow the pie” at the same time that they compete with each other to “divide the pie.”
Apple devices have long run Google as their default search engine. Facebook is the most popular app on everyone’s mobile devices. Amazon’s media collections are available and popular on Apple and Android devices, despite competing directly with Apple’s App Store and Google’s Play. Samsung actually manufactures many of the critical components for the very Apple iPhones that are competing with its own phones. The reason for all this cooperation is clear: the power of platforms. The power of Google in search, Amazon in media distribution, Facebook in social networks, and Apple and Android in mobile operating systems means that none of these businesses can afford to cut off their competitors from their own customers.
Hulu, an online streaming television service that combines the latest shows from the same networks that compete as direct rivals in traditional television distribution.
(Rogers, 2016, pp. 74–76)
Fluid Industries and Asymmetric Competitors
Companies can expect to compete with more and more businesses that do not look much like them. We can think of this as a shift from symmetric to asymmetric competitors. Symmetric competitors offer similar value propositions to customers. BMW and Mercedes-Benz have different brands and appeal to different drivers, but their offerings are broadly similar.
Asymmetric competitors are quite different. They offer similar value propositions to customers, but their business models are not the same. For an automaker like BMW, an asymmetric competitor might include a ride-sharing service like Uber—if customers buy fewer cars because Uber can fulfill their transit needs.
If HBO’s symmetric competitors are Showtime and AMC (offering programs to consumers through the same cable bundles), then its asymmetric competitors would include Hulu and Netflix, which provide viewing options and original content through digital devices and outside of the cable intermediary.
(Rogers, 2016, pp. 76–77)
Desintermediation and Intermediation
Desintermediation
This disruption and reconfiguration of business relationships is mostly talked about in terms of disintermediation—the removal of an intermediary or middleman from a series of business transactions.
Newspapers were disintermediated by classified websites like Craigslist or Monster.com.
Retail bookstore chains like Barnes & Noble and Borders Books were disintermediated by the arrival of Amazon.com, which for the first time offered publishers another path by which to sell books to consumers (Borders eventually filed for bankruptcy). In these cases, a new, digital-first challenger arrived to act as intermediary, letting the supplier sidestep its traditional channel for reaching customers.
Newer insurance companies, such as Geico (owned by Berkshire Hathaway), have entered the market that are selling directly to consumers online. Allstate Insurance has maintained its insurance agents while at the same time acquiring Esurance, which sells directly to consumers like Geico does. Allstate is, in essence, maintaining and disintermediating its sales partners at the same time.
Intermediation
In this case, a new business manages to insert itself as an intermediary between the customers and a company that used to sell directly to them. Intermediation happens when a platform builds such a large customer base and becomes such a valuable interface to customers that other businesses cannot afford to skip the opportunity to reach customers through that platform. The benefit to the new intermediary is that it inevitably extracts a toll or platform benefit, often capturing a great deal of value.
Facebook, for example, has managed to insert itself as an intermediary between news readers and news publications that previously reached them directly, whether through printed editions or their own websites and apps. With social media driving over 30 percent of all traffic to publisher websites and Facebook delivering 75 percent of that social traffic, no publisher, from BuzzFeed to The New York Times Company, can afford to skip using Facebook as a means to promote its content.
Apple Pay, the mobile payment system for iPhones, iPads, and Apple Watches, was able to enlist Visa and MasterCard as partners for its launch, despite the fact that Apple Pay is inserting itself as an intermediary between these credit card companies and their own cardholder customers.
When a consortium of 200 German publishers complained that Google was stealing value from them by including their articles in its search results, Google decided to simply exclude them from its searches. When they experienced a loss of traffic that they said could cause member publishers to go bankrupt, the consortium reversed course and asked Google to put their articles back in its search results.
(Rogers, 2016, pp. 78–79)
Tool: The Competitive Value Chain

Principles
- Power to the unique value creator:
- All news publishers are losing influence to Facebook, but those whose products are more of a commodity have much less leverage than a publisher like The New York Times Company, which has continued to maintain a differentiated brand in the eyes of readers.
- Unique value can come from a variety of sources: intellectual property, brand equity, network effects, anything that creates additional value for the final customer in the value train.
- Power to the ends:
- Power in value trains is moving to the ends, where there is less opportunity to be skipped over by business partners. In a value train, the first creator and the final distributor to the end consumer each have additional influence by virtue of their positions. By contrast, the parties in the middle tend to be boxed in and lose influence relative to the creators and end distributors.
- This power imbalance was described in manufacturing by Acer founder Stan Shih’s “smiling curve”: profits are inevitably captured by the companies that originate key patents and those that brand and distribute products, but the fabricators and manufacturers in between them languish in a valley of low leverage and profitability. Almost all digital platforms—whether Airbnb, Facebook, Google, or Apple Pay—seek to secure a position as the final interface to the end consumer because of the competitive leverage that it confers.
(Rogers, 2016, p. 83)
Data
For many of the digital titans of today’s business world, it seems clear that the data they capture regarding their customers is one of their most valuable assets. Much of Facebook’s market capitalization is rooted in the value of the rich data it collects on users and in its ability to harness that data with innovative tools for advertisers, helping them understand and reach precisely the right audience.
(Rogers, 2016, p. 92)
One of the most common ways that businesses can build an asset out of customer data is through loyalty programs.
(Rogers, 2016, p. 93)
By designing new customer experiences with data in mind, companies can extend this model of providing customer benefits in return for customer data gained.
(Rogers, 2016, p. 93)
Five Principles for Data Strategy
- Gather diverse data types: that serve different purposes.
- Use data as predictive layer in decision making
- Operations data can be used in statistical modeling to plan for and optimize the use of your resources. Customer data can be used to predict which changes in your services or communications may yield improved results.
- With detailed data from its MagicBands, Disney can make better-informed decisions on which merchandise to feature near different rides and how to manage variable demand and foot traffic.
- Apply data to new product innovation:
- TWC’s Hailzone mobile app is a perfect case of a company using its existing product data (for its TV shows and apps) to build a new service that added value for multiple customers (insurance companies and their insureds).
- Watch what customers do, not what they say:
- Behavioral data is anything that directly measures actions of your customers. It can include things like transactions, online searches (a powerful measure of your customers’ intentions), clickstream data (which pages they visited, where they clicked, and what they left in their shopping carts), and direct measures of engagement data (which articles in your newsletter they clicked to read).
- Behavioral data is always the best customer data
- Netflix knows that there are big differences between the movies that we give a five-star ranking and those that we actually wind up watching while doing the dishes on a Wednesday night.
- Combine data across silos:
- New York City Municipality Example (Case Studies)
(Rogers, 2016, pp. 94–96)
Key Data Types for Business Strategy
- Business process data: Manage and optimize business operations, reduce risk, provide external reporting.
- Inventory and supply chain
- Sales
- Billing
- Human resources
- Product or service data: Deliver the core value proposition of the business’ product or service
- Maps data (for Google)
- Business data (for Bloomberg)
- Weather data (for TWC)
- Customer data: Provide a complete picture of the customer and allow for more relevant and valuable interactions
- Purchases
- Behaviours and interactions
- Comments and reviews
- Demographics
- Survey responses
(Rogers, 2016, pp. 94–95)
Big Data
At first, the term seemed a bit faddish, a marketing ploy used by data storage firms to get IT departments to increase their spending on data servers. But the real changes at work have been much more profound than the size of hard drives or server farms.
(Rogers, 2016, p. 97)
The phenomenon of big data is best understood in terms of two interrelated trends: the rapid growth of new types of unstructured data and the rapid development of new capabilities for managing and making sense of this kind of data for the first time. The impact of these two is shaped by a third trend: the rise of cloud computing infrastructure, which makes the potential of big data increasingly accessible to more and more businesses.
(Rogers, 2016, pp. 97–98)
A business may have access to the ungrammatical text posts of social media, the flood of smartphone-generated images, real-time mapping and location signals, or the data from sensors rapidly spreading over our bodies and our entire world; all these types of data are rich in meaning—but difficult to parse by familiar tools like spreadsheets.
(Rogers, 2016, p. 98)
Social data is attitudinal (what people are saying can capture their opinions, likes, and dislikes) and can be used to measure affinity (whom they friend, follow, or link to reflects social ties and allows businesses to infer relationships between them and others in their network).
Hollywood predicts the opening weekend performance of new movies based on the social “chatter” after opening night, and economists have even used social media to effectively predict stock market performance.
(Rogers, 2016, p. 98)
The inclusion of location data with other kinds of behavioral data adds tremendous additional context.
Research by my colleague Miklos Sarvary has shown that the patterns of where we go at various times of the week (as measured by our phones) reveal a great deal about who we are. By analyzing these “co-location” patterns, Sarvary and his coauthors were able to show that customers with similar location “footprints” were likely to buy similar products and could be effectively targeted for marketing based on that data alone.6
(Rogers, 2016, pp. 98–99)
Three Myths of Big Data
- The algorithm will figure it out
- Making sense of big data still requires a lot of involvement by skilled human analysts.
- Biases can also exist in the algorithms used to look at the data, based on the assumptions of those who program them.
- Tariq Shaukat, chief commercial officer of Caesar’s Entertainment, puts it this way: “If you start with the data, you will end with the data. The question that I ask my teams all the time is, ‘What question are we trying to answer?’”
- Correlation is all that matters
- It is critically important that managers understand the difference between simple correlation and causation—and know when this difference matters and when it doesn’t.
- All the good data is big data
- Data does not always need to be “big” (i.e., unstructured) in order to be useful to a business. Powerful insights can be derived from the analysis and application of traditional, more structured data such as customer clickstream behavior
- Even at a big-data powerhouse like Facebook, home to some of the biggest server clusters in the world, most queries run by engineers on a given day are of a scale that could be processed on a good laptop.
- The point of your data strategy should be to generate value for your customers and business. Sometimes that will involve big data, and sometimes it won’t.
(Rogers, 2016, pp. 101–103)
Predictive Value
IBM’s Watson has moved to the real world. Physicians have trained Watson, using a library of millions of patient case histories, to the point where Watson is more accurate than many doctors in making an initial diagnosis of a new cancer patient.
(Rogers, 2016, pp. 100–101)
Where to Find Data
- Customer Value Data Exchange
- One of the best ways to generate additional data is to invite customers to contribute data as part of interacting with your business or in direct exchange for value you offer them. [For example], the navigation app Waze built both its map data and its real-time traffic data through user contributions.
- Four key factors: the type of value or rewards offered, the presence of a trusted relationship with the business, the type of data being requested, and the industry of the business.
- Lead User Participation:
- Lead users (a term coined by Eric von Hippel10) are your most active, avid, or involved customers.
- The Weather Underground: the volunteer army of meteorological enthusiasts who happily contribute real-time feeds of additional weather data to TWC as part of participating in that community.
- By engaging lead users, brands can solicit input and feedback from much more selective and important communities.
- By engaging lead users, brands can solicit input and feedback from much more selective and important communities.
- Supply Chain Partners
- Public Data Sets
- The car reviews website Edmunds.com, for example, contains many years’ worth of discussion forums—providing huge amounts of unstructured data in customers’ conversations about car models, makes, preferences, and experiences.
- The U.S. government’s census data, for example, has been in huge demand since being made available.
- Purchase or Exchange Agreements
- Anonymized data lets a company learn things like the conversion rate of offers (the portion of customers accepting the offer sent). The company’s data shows which customers got the offer, the retailer’s data shows who made a purchase, and the third-party service measures the conversion rate without revealing customer identities (which could be a violation of privacy terms).
- During the 2014 World Cup, Waze shared anonymous driver data with city governments in Brazil to help them identify and respond more quickly to traffic buildups and road hazards. In Rio de Janeiro alone, up to 110,000 drivers a day were providing traffic data through Waze’s API. Since then, Waze has been developing partnerships with other governments, such as the State of Florida. The company is not asking for payment but rather is seeking an exchange of more data. By receiving real-time data from highway sensors and information on construction projects and city events, Waze is improving its own data asset.
(Rogers, 2016, pp. 103–106)
Turning Customer Data into Business Value
As organizations gather more data and develop it into powerful assets, the next challenge is to continuously apply these assets to create new value for themselves.
Four templates for creating value from customer data:
- Insights: Revealing the Invisible:
- Customer psychology (How are my brands or products perceived in the marketplace? What motivates and influences customer decisions? Can I predict and measure customer word of mouth?).
- Customer behavior (How are buying habits shifting? How are customers using my product? Where is fraud or abuse taking place?).
- Impact of specific actions on customers’ psychology and behavior (What is the result of my change in messaging, marketing spending, product mix, or distribution channels?).
- Targeting: Narrowing the Field
- Today, advanced segmentation schemes can be based on much more diverse customer data and can produce dozens or even hundreds of micro-categories.
- How a customer is targeted can change in real time as well, as they are assigned to one segment or another based on behavioral data such as which e-mails they clicked on, rewards they redeemed, or content they shared.
- Ideally, customer lifetime value should be included as one metric for targeting customers based on their long-term value to the business.
- Personalization: Tailoring to Fit
- Once businesses are targeting micro-segments of customers, the next opportunity is to treat them each differently, in ways that are most relevant and valuable to them.
- Context: Providing a Reference Frame
- How one customer’s actions or outcomes stack up against those of a broader population
- Putting data in context is at the heart of the “quantified self” movement—evidenced by customers’ rising interest in measuring their diet, exercise, heart rates, sleep patterns, and other biological markers.
(Rogers, 2016, pp. 106–112)
Tool: The Data Value Generator

*1 — Are of Impact and Key Performance Indicators
- Define the area of your business you are seeking to impact or improve through a new data initiative.
- For example: develop better product recommendations, to improve outbound communications to existing customers, to improve the customer call center, or to develop a new app to drive customer engagement.
- What goals are you hoping to support? In addition to broad goals, what are your established key performance indicators (KPIs) that are being used to measure performance?
- What are the highly measureable outcomes?
2 — Value Template Selection
- Identify one or more that may be most relevant to your objectives
- Insight
- Targeting
- Personalization
- Context
- Whereas targeting efforts are sometimes focused only on identifying the right audience, effective personalization requires that you have some system of targeted segmenting in place.
3 — Concept Generation
- Ideate specific ways that data could deliver more value to your customers and your business.
- Concept generation should aim for this level of concrete application so you can really define the possible data strategy.
- At the concept generation stage, you want to produce specific ideas for putting the data to work in your business.
4 — Data Audit
- Assemble the required data for the selected strategy. That starts with surveying what data you already have that could be used to enable or power your strategy. You may have a large, established data set based on your core product or service (like TWC).
- Next you should identify what data you still need:
- more records or rows
- more types of data
- more historical data
5 — Execution Plan
- You must put that strategy to use in the work of your organization.
- What technical issues need to be worked out? This may include data warehousing, latency, or how quickly the data needs to be updated.
- What business processes will need to change?
- How can you test out your strategy and build internal support?
(Rogers, 2016, pp. 113–116)
Organisational Challenges of Data
When Mike Weaver was brought in as director of data strategy for the Coca-Cola Company, his mission was clear. “We must understand consumers’ passions, preferences, and behaviors so we can market to them as individuals,”
(Rogers, 2016, p. 117)
Challenges:
Before a brand can take advantage of its ability to differentiate customer segments in real time and deliver targeted messaging to them, it first needs to learn how to create messages in a very different way.
- Embedding Data Skill Sets
- Good data scientists have strong statistical and programming skills and often come from an academic or scientific background. They also serve as truth-tellers within the organization. These are the folks who know that data can lie very easily, and they will keep a company honest about things like sample size, significance testing, and data quality (the old “garbage in/garbage out” rule).
- Bridging Silos
- Sometimes the biggest challenges to sharing data are within the organization. At Coca-Cola, Weaver found that website analytics data was sitting in one database while data on consumer purchase behavior from loyalty programs was being kept somewhere else entirely. In order to create a complete picture of the customer, he first had to bring all the data together in a unified way.
- The most commonly cited obstacle to using data effectively was internal sharing, with 51 percent of respondents reporting that “the lack of sharing data across our organization is an obstacle to measuring the ROI of our marketing.”
- Sharing Data With Patners
- Contracts and deals of all kinds are no longer just about who pays what to whom but what data will be shared as well. This sharing is particularly important for businesses that don’t own the ultimate point of sale for their products.
- Cybersecurity, Privacy, and Customer Attitudes
- Part of data strategy is developing a legal, risk management, and security plan.
- Advocacy around consumer data privacy has raised the possibility of government regulation in many markets.
- With rising concerns about ownership of personal data, it is increasingly important that any data strategy be based on a transparent value exchange with the customer: an exchange in which the customer knows that data is being collected and sees the benefits they are receiving in return. This is the foundation of loyalty programs with points and rewards. It is also the reason customers willingly provide personal ratings on a service like Netflix and are not alarmed when Amazon suggests products based on their recent browsing history. When customers can easily see both the ways that companies are gathering data and the benefits they are gaining as a result, they will be more likely to allow sustainable access to businesses.
Innovation
As Scott Anthony says, innovation is not just about “big bangs”; it is about anything new that has impact.
(Rogers, 2016, p. 124)
Traditionally, innovation was singularly focused on the finished product. Testing ideas was relatively difficult and expensive, so decisions and early ideas were based on the analysis, intuition, and seniority of managers involved in the project. Actual market feedback tended to come very late in the process (sometimes after public release), so avoiding a marked failure was an overriding concern.
In the digital age, enterprises need to innovate in a radically different fashion, based on rapid experimentation and continuous learning. Rather than concentrating primarily on a finished product, this approach focuses on identifying the right problem and then developing, testing, and learning from multiple possible solutions.
This approach focuses on developing minimum viable prototypes and iterating them repeatedly—before, during, and even after launch. At every stage, assumptions are tested and decisions are made based on validation by customer and market responses.
(Rogers, 2016, p. 124)
To improve its products, Google doesn’t sit down with customer focus groups to discuss their search engine experiences. Nor does it convene a committee to vote on which new features to implement. Instead, the company is constantly experimenting, testing each of its new ideas, measuring customer response, and iterating on what it learns.
(Rogers, 2016, pp. 123–124)
Experimentation is Learning
Not everything called an experiment is the same. Different types of business experiments may not be designed or run in the same manner or be used to answer the same kinds of questions. But all business experiments do have this in common: they seek to increase learning by testing ideas and seeing what works and what doesn’t.
(Rogers, 2016, p. 128)
Convergent and Divergent Experiments
- Convergent experiments are best suited for learning that eliminates options and converges on a specific answer to a clearly defined question (e.g., Which of these three designs is preferred by the customer?).
- Divergent experiments are best suited for learning that explores options, generates insights, asks multiple questions at the same time, and, when done right, generates new questions to explore in the next iterative stage. (See table 5.2.)
(Rogers, 2016, p. 129)
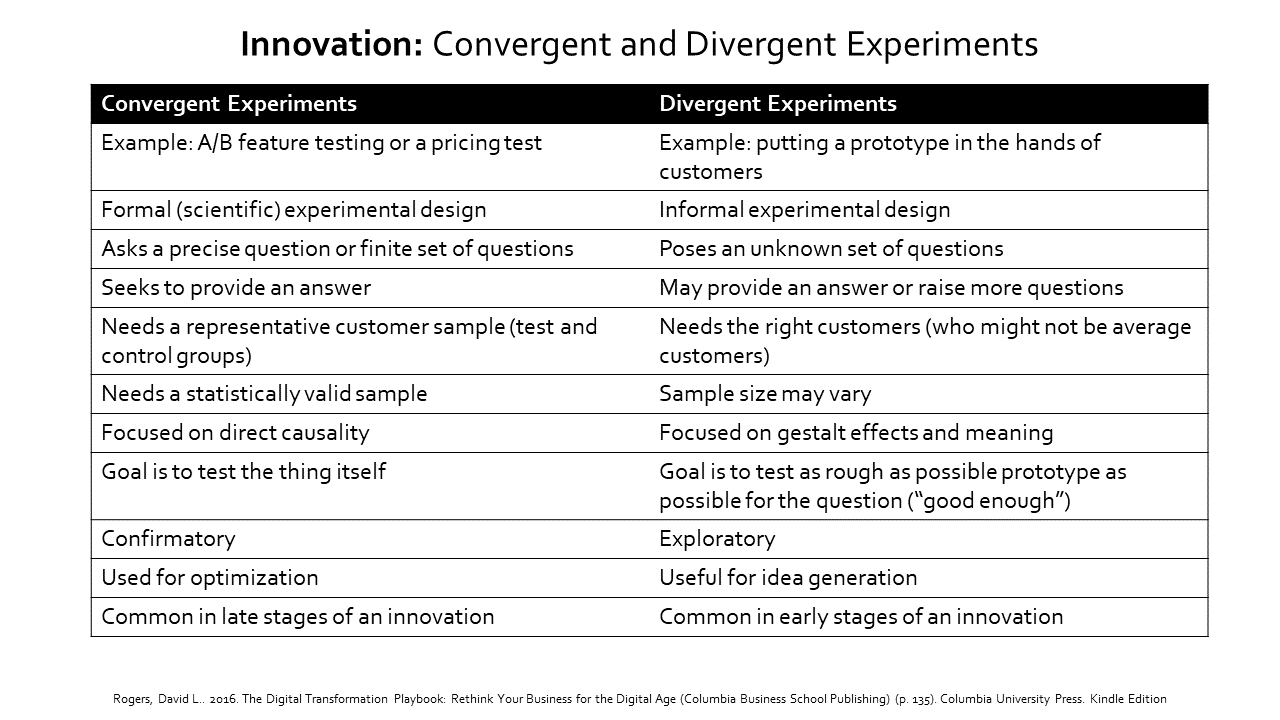
Convergent Experiments
The key element of every convergent experiment is the initial causal hypothesis: “If I add this feature, customers will spend more time on my site.” Or “If I change this interaction, customers will spend more money in my store.” Convergent experiments are critical for cases where it is not enough to know the correlation between two events; you also need to verify which event is causing the other.
Amazon and Facebook, are constantly running A/B tests, in which two sets of customers see the same webpage (or the same e-mail) with one difference in design and the company measures any difference in customer behavior or response.
A convergent experiment can be as expensive as testing two different store layouts for a retail chain or as cheap as sending two versions of an e-mail promotion, each to a different group of randomly selected customers, and comparing the responses.
Because convergent experimentation needs to measure causality, it needs to adhere to the key principles of formal scientific experiments.
- Causal hypothesis: there is an independent variable (the cause) and one or more dependent variables (the effect)
- Test and control groups: to see the difference between those who are exposed to the stimulus and those who aren’t
- Randomly assigned participants: so that an external factor doesn’t influence the outcome of the test group
- Statistically valid sample size: so that the measured differences can rise above the noise of random fluctuations
- Blind testing: to avoid the Hawthorn effect, where those involved in the experiment unintentionally influence its outcome
(Rogers, 2016, p. 130)
Divergent Experiments
The process of divergent experimentation is more informal than that of convergent experimentation. But that does not mean that divergent experimentation is simply ad hoc. It is still structured and benefits greatly from a clear process for conceiving of options or ideas, creating meaningful prototypes, testing these to gather real-world feedback on critical assumptions, and using that information to make decisions about whether to proceed and how to launch an eventual solution.
A common mistake in divergent testing is testing too late, when the development is nearly complete.
(Rogers, 2016, pp. 131–132)
The Need For Both
Successful innovation must balance both exploratory learning (to generate and develop new ideas) and confirmatory learning (to generate and develop new ideas).
(Rogers, 2016, p. 132)
New software tools are becoming available that allow even small firms with limited budgets to easily conduct A/B tests, run multivariable analysis on the results, and determine the optimal sample size for an experiment. For example: Optimizely which allows small businesses to start running A/B tests on their websites and mobile apps for free.
Seven Principles of Experimentation
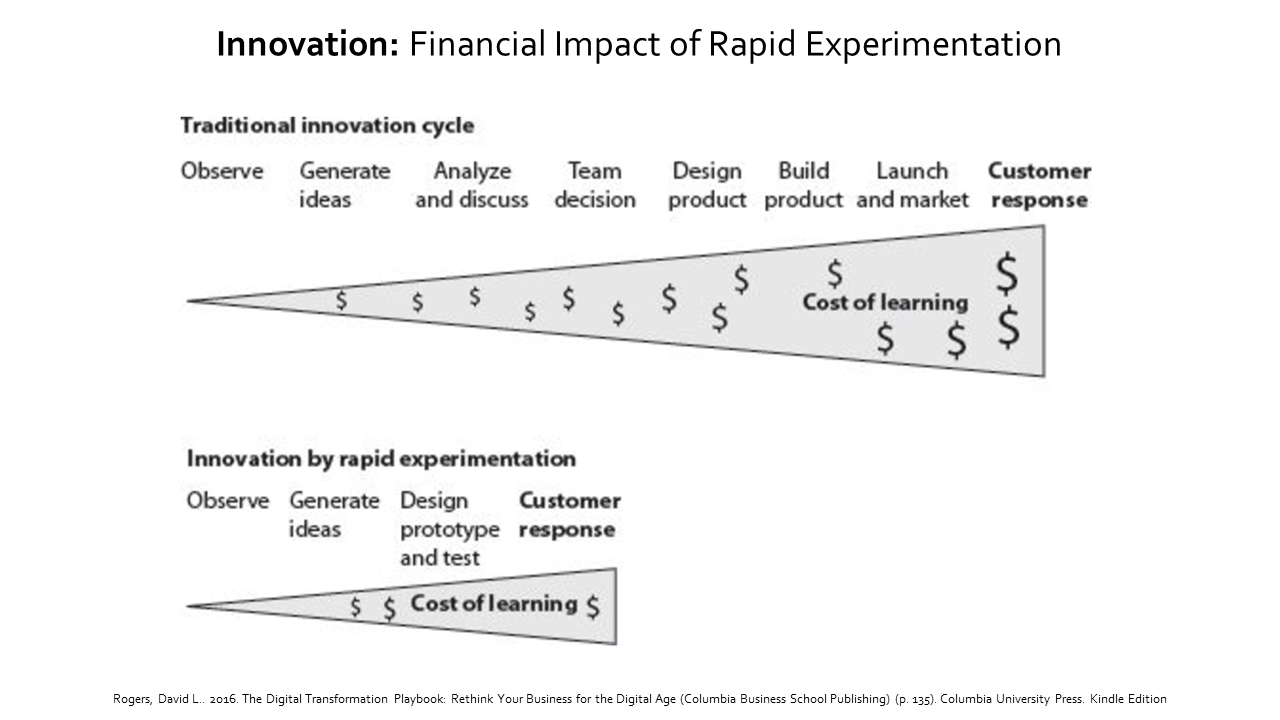
- Learn Early
- With experimentation, the ideas that don’t work should fail early in the development process, long before your product gets to the public and while the cost of changing course is much lower.
- Waiting too late in your innovation process to show your ideas to customers has the inverse effect: it increases the cost of error, reduces the likelihood that you can muster the organisational will to change course, and discourages you from testing other options.
- With much earlier learning, the failure rate of the company’s product ideas may not decrease, but the cost of failure may drop dramatically
- Be Fast and Iterate
- “The real measure of success is the number of experiments that can be crowded into 24 hours” (Thomas Edison)
- Increasing the speed of experimentation may require infrastructure.
- Fall in Love with the Problem, Not the Solution
- By forcing yourself to describe the customer’s problem first (rather than the ingenious solution you are developing), you take an important step to ensure the innovation process is focused on customer value.
- By focusing on the problem, you consider more than one possible solution. If your goal is the solution itself, there’s a temptation to stop generating new ideas when you hot on one idea that appears promising to your team and to move on prematurely to building it.
- You inevitably become emotionally attached to a creative solution.
- Get Credible Feedback
- It stats with the people you speak to. They need to be real customers or potential customers—not yourself, your colleagues, or your executive sponsor.
- In a convergent experiment, the feedback is based on the actual product, service, or experience you would ultimately provide.
- In a divergent experiment, the goal is to use prototypes; they can be made with simple materials, like paper or cardboard or clay.
- A common mistake is to ask a focus group of customers to speculate on a product or service they’ve never seen, with no prototype with which to interact.
- Measure What Matters Now
- As interactions become more digitized, the number of things that can be measured is growing, and it is easy to get distracted by all the numbers you could be tracking—particularly in a real-world experiment with a large customer sample.
- One solution is to try to identify the most important single metric for the success of your nnovation.
- The “One Metric That Matters” will change over time
- Test Your Assumptions
- In their book Discovery-Driven Growth, Rita McGrath and Ian MacMillan explain how succesful firms take on undue risk by not identifying the underlying assumptions of their new ventures.
- Fail Smart
- Did you learn from the failed test?
- Did you apply that learning to change your strategy?
- Did you fail as early and as cheaply as possible?
- Did you share your learning?
(Rogers, 2016, pp. 134–142)
Tool: The Convergent Experimental Method
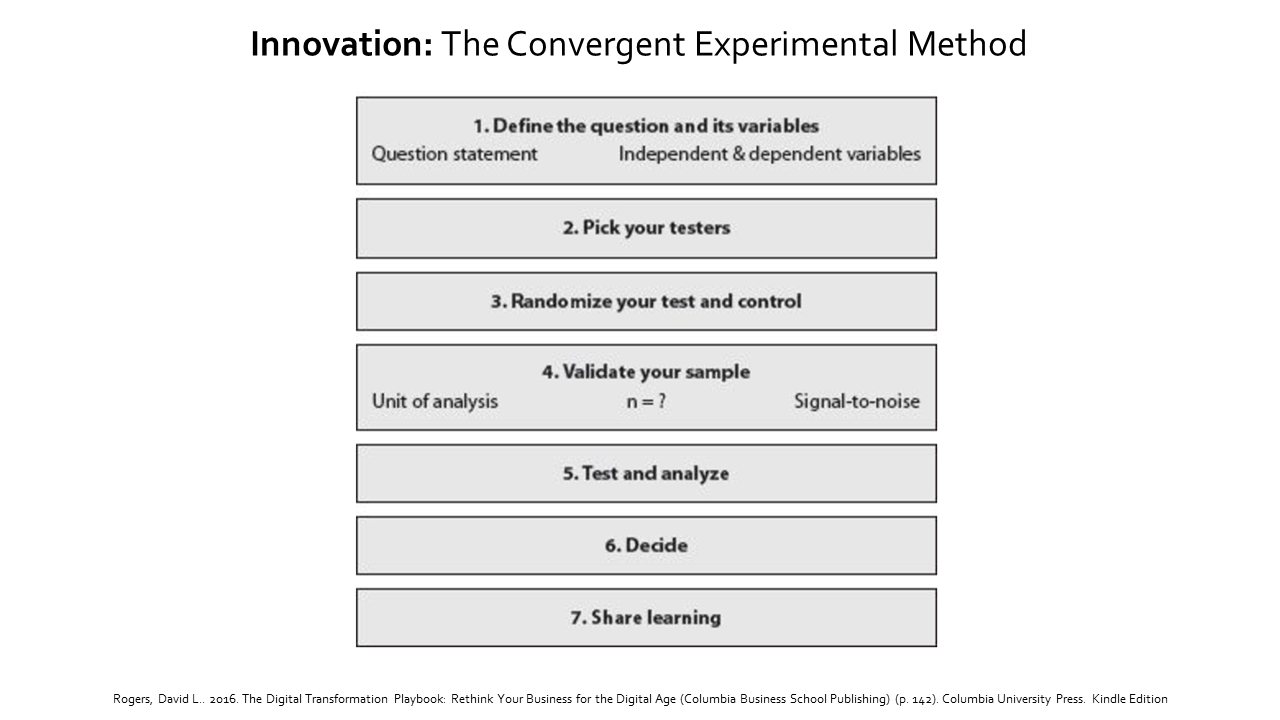
1 — Define the Questions and Its Variables
- In a convergent experiment, the question needs to be as specific as possible. It should also be framed, if possible, as a causal question: “If we do X, then what will happen to Y?”
- The question needs to be translated into two kinds of variables:
- Independent variable (or cause): Typically, the variation on current business practice. The aim of the experiment is to understand the effect of introducing this innovation.
- Dependent variable (or effect): The factor that you expect may be influenced by your new innovation. It is a measure of the impact of what you are changing
2 — Pick Your Testers
- Because it follows formal experimental practices, the test that will require some statistical knowledge or tools
- Many tests can be automated with software tools such as Optmizely and MailChimp
- A testing team may be necessary
3 — Randomize Your Test and Control
- Identify a population whose responses you want to test
- Assign members of that population to one or two groups
- The test group (or treatment group), which receives the experience or offer you are testing
- The control group, which does not
4 — Validate Your Sample
- What is a statistically valid sample size?
- The typical rule of thumb is to have n = 100, at a minimum, in each group you are comparing. However, depending on your signal-to-noise ratio, you may need a larger sample size.
5 — Test and Analyze
- Differences in the dependent variables you are measuring and, if there are, whether those differences are statistically significant.
- It is important to gather data beyond the dependent variables that you chose in step 1 to define success for your experiment.
6 — Decide
- If you do find a desired improvement from your innovation test, the story may not be over.
- This should often lead to further iteration and testing of additional ideas to see if they can lead to greater improvement.
7 — Share Learning
It is critical to both document what you learned and communicate your findings to others in your organization who could benefit (and could avoid any of the same mistakes).
(Rogers, 2016, pp. 142–146)
Tool: The Divergent Experumental Method
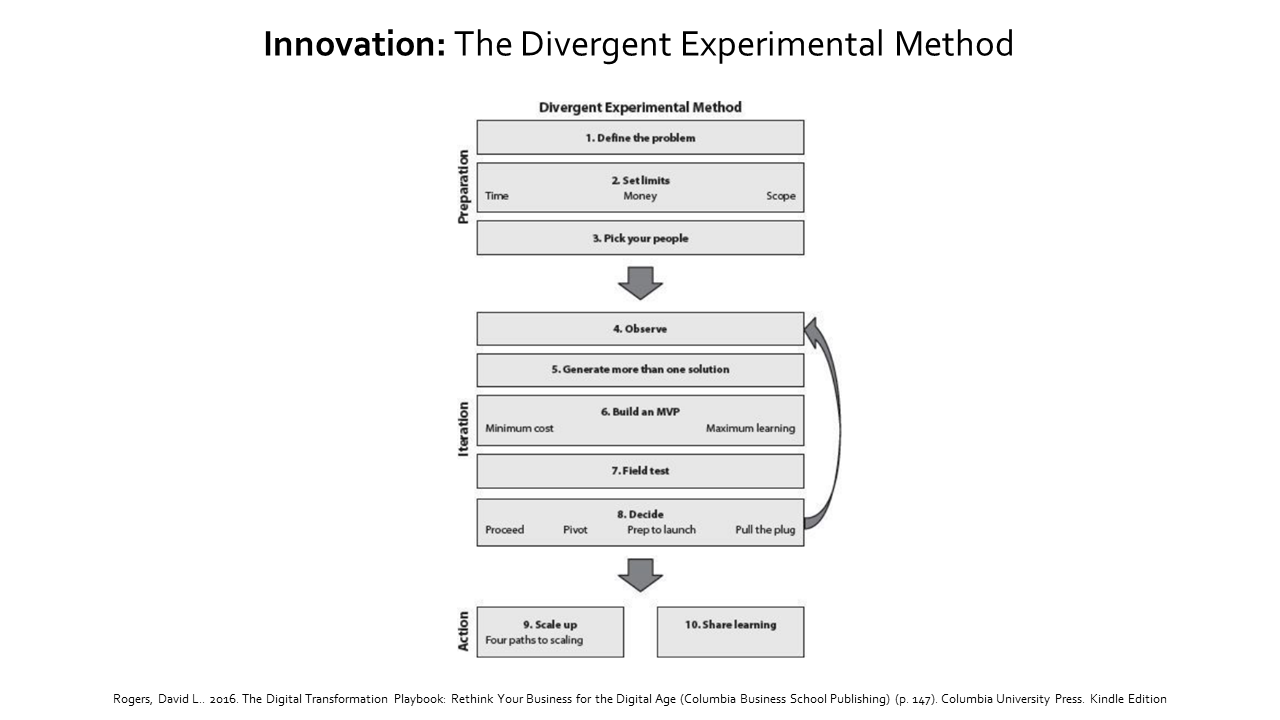
1 — Define The Problem
Your innovation should always focus on delivering value to the customer (even if that customer is an internal constituency).
2 — Set Limits
Any divergent experiment should begin with three kinds of limits defined:
- Time limit: Finite time should be allotted for the project and its key approval stages.
- Money limit: Budgeting for innovation projects is often best done in approval stages.
- Scope limit: Companies should define up-front what they are not asking to accomplish.
3 — Pick Your People
- Team size: e.g. 2 Pizza Rule
- Diversity of team composition: diverse biases and backgrounds.
4 — Observe
- The goal of observation is to both deppen your understanding of the problem itself and broaden the range of ideas you bring to bear in finding a solution
- You should focus first on observing the customer’s context
- Look for ideas from further afield. Look at other markets (how other customers deal with the same issue) and other industries.
5 — Generate More than One Solution
- The intention is to help create new ideas and possible solutions (not to evaluate them, which should be done by the customer)
- The goal should always be to generate multiple viable ideas
6 — Build an MVP
- Translate your ideas into prototypes
- The most important point is that your MVP should absolutely not be a full-blown or finished product.
- The goals of an MVP: minimal cost + maximum learning.
7 — Field Test
- Aim for as natural an environment as possible.
- Test your prototype with an audience as similar as possible to the customers you expect will be using the final version.
- Identify assumptions you are seeking to validate before the test:
- Customer value assumptions:
- Do customer value your solution?
- Will they use it?
- What will they pay for it?
- Which customers are the best fit?
- What additional value are they still looking for from your solution?
- What parts did they not find necessary?
- Business model assumptions:
- How will you manufacture your offering?
- How much will this cost?
- How will you market it, distribute it and acquire new customers?
- How might competitors respond?
- Customer value assumptions:
8 — Decide
- For startups, the decision is often “pivot or preserve”
- For an established business, the decision after each test is one of four options:
- Proceed
- Your field test has validated your ideas so far
- You can move on to the next round of prototype development and assumptions testing (Step 4)
- Pivot
- Your field test has raised issues
- You may need to adjust your idea based on what you learned or go back to test another solution you generated before to see if it is more promising (Step 4)
- Prepare to launch
- You have validated your innovation and ready to bring it to market (Step 9)
- Pull the plug
- If you’ve tested all your solutions or you’ve hit the limits of your time or budget, now is the time to stop the process and assess what you’ve learned (Step 10)
- Proceed
9 — Scale Up
- Translate your prototype into a full release in the marketplace
- Rollout a plan for manufacturing
- Where and how
- Distribution (which channels)
- Marketing (advance buzz, launch, and beyond)
- Training, business process integration, and change management
- Secure more resources: staff, budget, and executive sponsorship.
10 — Share Learning
It is vital to preserve the learning that came through your process.
(Rogers, 2016, pp. 142–146)
Paths for Scaling Up an Innovation
Questions to answer:
- Can you iterate the offering quickly after launch? (It is more difficult in the case of physical products)
- Can you limit your rollout to stages, or does the innovation have to be released to all customers at once?

- MVP Rollout (First Path)
- Limited to a market subset
- Easiest path
- The idea is to bleed right from an MVP prototype into actual product development
- MVP Launch (Second Path)
- Expose to the totality of the intended market
- May be required when:
- Network effects are needed (e.g. both sellers and buyers conform the platform’s population)
- The release of innovation may not be limited due to the high visibility of the brand or the expectation that the initiative may draw wide attention.
- Polished rollout
- The innovation is lunched in limited locations or for limited customers
- It is not possible to iterate quickly
- It has the advantage of rolling innovation out in “stages” by validating initial findings
- Polished Launch
- All innovation must be delivered to all customers at once
- It is not possible to iterate quickly
- Typical in manufacturing of physical objects: automobiles, pharmaceuticals, etc.
- A patterned used by Apple
(Rogers, 2016, pp. 154–158)
Inappropriate Learning Culture
Risks:
- Incremental innovation efforts: Risk aversion: those involved in failed projects are punished or stigmatized. Employees tasked with innovation will shy away from any unknowns, including both growth opportunities for the firm.
- Loss of learning: When failures are punished, there is no incentive to bring failures to light.
- Throwing good money after bad: When failures are punished, any team with a budget will find a way to justify their underperforming initiative as “just needing a little more time”.
(Rogers, 2016, p. 162)
Value

Launched in 1999, Napster offered a peer-to-peer service for swapping MP3 music files over the Internet, with no payment to the copyright holders whatsoever. Yes, it was illegal. But the value proposition was irresistible for many customers. On the one hand, they had the RIAA, offering them great recordings of their favourite music.
(Rogers, 2016, p. 166)
Three Routes Out of a Shrinking Market Position

- New Customers
- May be difficult in relatively flat and open markets
- Example: Mohawk Fine Papers (Case Studies)
- New Value (Same Customers)
- It involves adapting the value proposition to stay relevant to changing needs.
- It requires a business to be willing to depart from has brought it success in the past.
- It means changing
- from: “How can I get my customers to sill pay me?” to
- to: “How can I become valuable to my customers as I used to be—or more so?”
- New Value + New Customers
(Rogers, 2016, p. 169–)
BackLog
Look for books from Some of the key writers on convergent experimentation for business include Stefan Thomke, Thomas Manzi, Eric T. Anderson, and Duncan Simester.9
BibTeX
@book{rogers2016,
  Author = {David L. Rogers},
  Title = {{The Digital Transformation Playbook: Rethink Your Business for the Digital Age}},
  Publisher = {Columbia University Press},
  Year = {2016},
  ISBN = {0231175442}
}
Rogers, D.L., 2016. The Digital Transformation Playbook: Rethink Your Business for the Digital Age. Columbia University Press.